The short version: Ransomware exposure grows with revenue — but cyber limits don’t
Four in five large companies we modelled with ELM v3.68 would face a 1-in-100-year ransomware loss bigger than the average cyber tower bought by $1B+ firms. Across 160 companies in the US, Canada, the UK, Germany and Australia, Concinnity Risks’ Extortion Loss Model (ELM) puts the median 1-in-100 ground-up loss at $90M for a $1–10B business and $638M for a $100B+ one. The benchmark average limit for $1B+ buyers sits around $50–65M.
Ransomware exposure grows with revenue, but also more slowly than revenue. Sector moves it as much as size, and both are things a broker can show a client, in numbers, before the renewal conversation. Let’s explore how this would bring value to the insured as well as the broker.
How exposure moves with revenue
A company ten times larger faces roughly 3.5 times the tail loss, not ten times. Bigger firms lose more in dollars, but less as a share of what they earn.
| Revenue band | Companies | Median revenue | Median 1-in-50 loss | Median 1-in-100 loss | Median 1-in-250 loss |
|---|---|---|---|---|---|
| $1–10B | 10 | $7.2B | $46M | $90M | $129M |
| $10–100B | 79 | $41.7B | $89M | $195M | $298M |
| $100B+ | 71 | $300B | $434M | $638M | $858M |
As a share of revenue, the median 1-in-100 loss falls from about 1.1% in the $1–10B band to 0.6% at $10–100B and 0.17% above $100B. For a growing client that is two messages at once. Their absolute exposure keeps rising, so the limit that was right three years ago probably isn’t now you’ve grown your business. And per dollar of revenue they get cheaper to protect, which is an argument for buying more limit, not less.
The frequency picture is flatter. For a typical firm in every band, the model’s chance of any ransomware loss in a year is about 1 in 20. What changes with size is how bad a bad year gets, the devil is in the tails.
By country. Inside the $10–100B band, where four of the five countries have enough companies to compare, the median 1-in-100 loss as a share of revenue is 0.60% in Canada, 0.50% in the UK, 0.42% in Germany and 0.23% in Australia. All 28 US companies in this portfolio sit above $100B revenue, so the US median of $1.17B mostly reflects size. A like-for-like US comparison needs a mid-market portfolio for comparison, and isn’t helpful or illustrative for this broker perspective.
Exposure against revenue
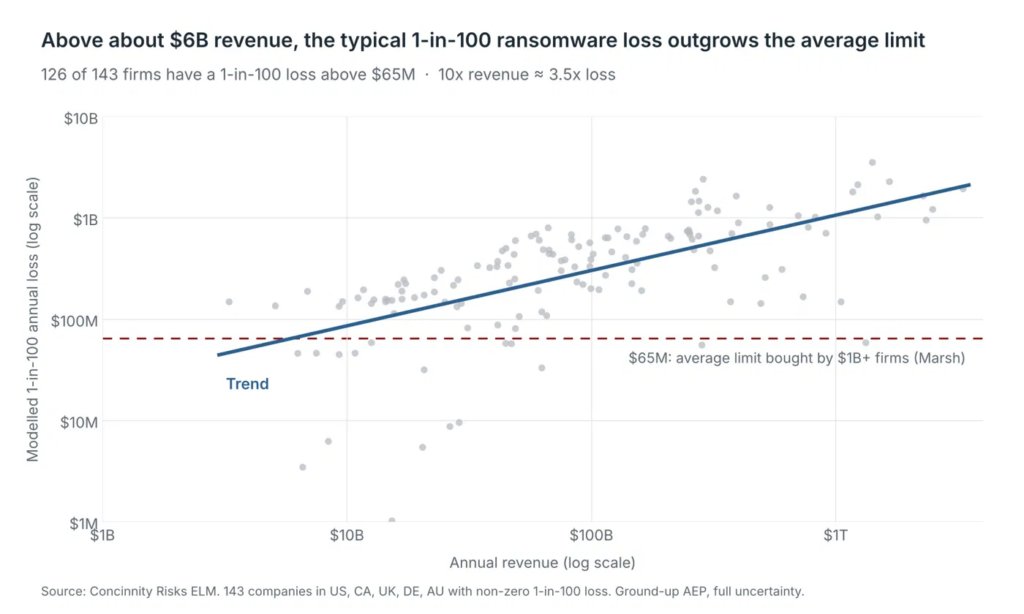
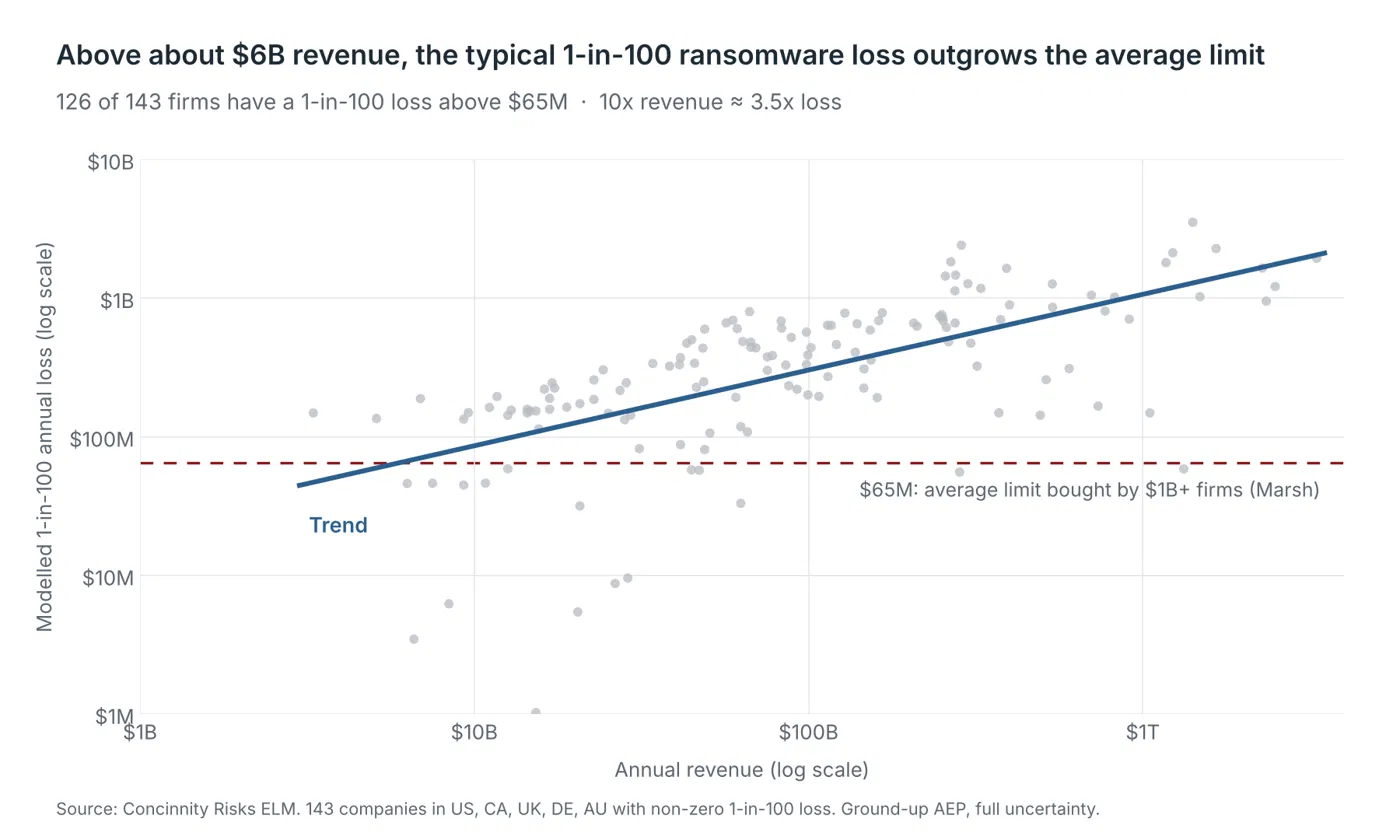
Each dot is one company. The dashed line is what an average $1B+ buyer holds; most companies sit well above it, and the gap widens with size.
Sector matters as much as size
Two companies with the same revenue can need very different limits. Manufacturing and extractive firms, where an outage stops physical production, carry the heaviest relative tail. Banks and insurers, despite being frequent targets, lose less per dollar of revenue in the model.
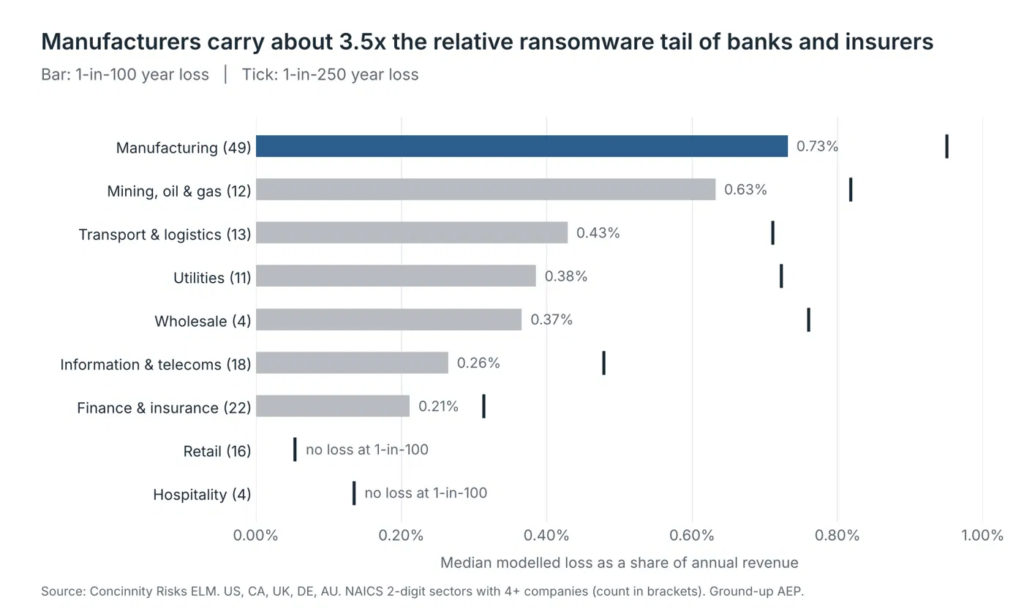
Retail and hospitality show no loss at 1-in-100 for the median firm, but a real one by 1-in-250. That is a classic heavy-tail trap: a client who looks only at the likely years will conclude they don’t need much cover. Hospitality and wholesale rest on four firms each, so treat them as indicative.
The limit gap
A $65M tower covers about 72% of a 1-in-100 ransomware year for a $1–10B company, 40% at $10–100B and 16% above $100B. That $65M is Marsh’s reported average limit for US clients with revenue above $1B (Marsh, 2020, 2019 data). A more recent European benchmark lands in the same place: French companies with turnover above €1B bought an average of about €50M of cyber capacity in 2025 (AMRAE LUCY, July 2026).
| Revenue band | Share of firms whose 1-in-100 loss exceeds $65M | Share of the 1-in-100 loss a $65M limit covers | Same, at 1-in-250 |
|---|---|---|---|
| $1–10B | 50% | 72% | 58% |
| $10–100B | 80% | 40% | 29% |
| $100B+ | 82% | 16% | 11% |
Two benchmarks six years and an ocean apart agree on a $50–65M average for $1B+ buyers. Our model says the median $10–100B company needs about three times that to cover a 1-in-100 year. Even granting that not every modelled cost is insurable, that is a gap a client should see before they choose their limit.
The trade press calls this the cyber protection gap. The Insuring Cyber Podcast has covered how it is widening (Carrier Management, Oct 2023), and the BIS estimates that only about 1% of global economic cyber losses are insured (BIS FSI Insights No 75). For one client, the protection gap is the distance between what a bad ransomware year costs and what their tower pays.
Many large buyers are not buying at all. Marsh reported that only 47% of its US clients above $1B revenue bought cyber cover in 2022 (Marsh).
Capacity used to be the problem. Now demand is.
Towers used to be the hard part. In 2015 Lockton described marketing a single $200M tower to 45 underwriters (Advisen, 2015). In the last hard market, Berkshire’s National Indemnity pitched $1B of excess cyber limit as a “market of last resort” (Insurance Insider US), while London brokers said $250–300M standalone towers were still achievable (Insurance Insider).
That is no longer the constraint. Lockton reports plentiful cyber capacity, average premium falls of 11% across its portfolio in 2025, and new MGAs and a new syndicate entering in early 2026 (Lockton, Feb 2026). Marsh says limits are rising steadily as rates soften (The Insurer, Nov 2025), and WTW’s autumn 2026 report advises buyers to reinvest their savings in higher limits (Insurance Journal, Oct 2026).
What is missing is demand. Lockton notes that demand “is still insufficient to satisfy all market participants.” A CFO doesn’t buy a bigger tower because capacity is cheap. They buy it when they can see the loss it pays for. A modelled loss curve gives the client that reason, and it answers the question every excess underwriter asks: how likely is a loss to reach my layer?
Why brokers should bring a cyber model to the renewal discussion
A loss model turns the limit conversation from “what did peers buy?” into “what could this cost you?” Peer benchmarks tell a client what is normal. They don’t tell the client whether normal is enough, and the numbers above suggest it often isn’t.
Three conversations a model makes possible:
- Growth. Show a client how their 1-in-100 loss moves as revenue doubles or triples, or pivots to a new sector. A firm that grew from $5B to $15B since it last set its limit has roughly doubled its tail exposure.
- Sector. A manufacturer and a retailer of the same size can sit a factor of three or more apart. A sector-specific view stops the client buying a limit set for someone else’s risk.
- Limit adequacy. Put the client’s tower next to their modelled 1-in-50, 1-in-100 and 1-in-250 losses. The client then decides how much of a bad year they want to keep, knowing what they are choosing.
This is how a broker earns their commission: A broker who only places the same limit as last year is a transaction. A broker who can show a CFO, in their own revenue terms, where their programme runs out is giving advice the client can’t get from a price comparison. That analysis is the value the commission pays for, and it is easier to defend at renewal when the client has seen it.
Method notes
- Model and portfolio. ELM sector proof run (OasisLMF output), 160 companies in the US (28), Canada (30), UK (35), Germany (36) and Australia (31), revenue $3.3B to $3.3T. Revenue is the exposure value (TIV).
- Measure. Ground-up aggregate exceedance losses (AEP) with full uncertainty, per company. Ground-up means before deductibles and limits, across extortion, incident response, business interruption, data recovery, regulatory and liability costs. Not all of it is insurable, so the gap above is an upper bound on the insurable shortfall.
- Bands. No company in this run is below $1B revenue, so the $1–10B band has only 10 firms. SME and mid-market conclusions need a separate blog post, and you’ll see that in the near future.
- Benchmarks. Limit averages are from published broker and risk-manager surveys, not from Concinnity data. The Marsh figure is US and 2019; the AMRAE figure is France and 2025.
- Sector. Medians by NAICS 2-digit sector, shown only where a sector has at least four companies.
Try ELM
If you are interested in trying ELM, we are offering free evaluations for brokers. Bring a client or a book of business, and we’ll show you their modelled ransomware losses against the limits they hold today. We can do that as a demo and conversation or we can direct you to our hosting partners Cestida, Verisk, and Oasis SaaS.